Mapping the Big One Hazard in the Philippines 2025
Recent major earthquakes across the Philippines (September-October 2025) have understandably heightened nationwide awareness regarding seismic hazards. In Metro Manila, this brings renewed focus to the “Big One” – a devastating M7.2 earthquake scenario anticipated from movement along the West Valley Fault. This 100-kilometer fault system transects several cities in the capital region and adjacent provinces, potentially impacting millions. As awareness grows, so does the realization that understanding true vulnerability requires looking beyond just proximity to the fault line.
This article leverages geospatial analysis to provide a clearer picture of potential impacts. We’ll examine earthquake scenario data from a crucial 2013 government study, enhance it through normalization techniques, and overlay it with recent aggregated resident data (September 2025) from Inquiro’s datalake. (Disclaimer: This analysis is for informational purposes and is not an official risk assessment report.)
The Valley Fault System: A Looming Threat
The Valley Fault System consists of two main segments:
-
East Valley Fault (EVF): A ~10km fault in Rizal, capable of generating an estimated M6.2 earthquake.
-
West Valley Fault (WVF): A ~100km fault considered the primary threat to the capital region. It directly intersects Quezon City, Marikina, Pasig, Makati, Taguig, and Muntinlupa, extending into nearby provinces. The WVF is projected to be capable of generating an M7.2 earthquake – the “Big One.”
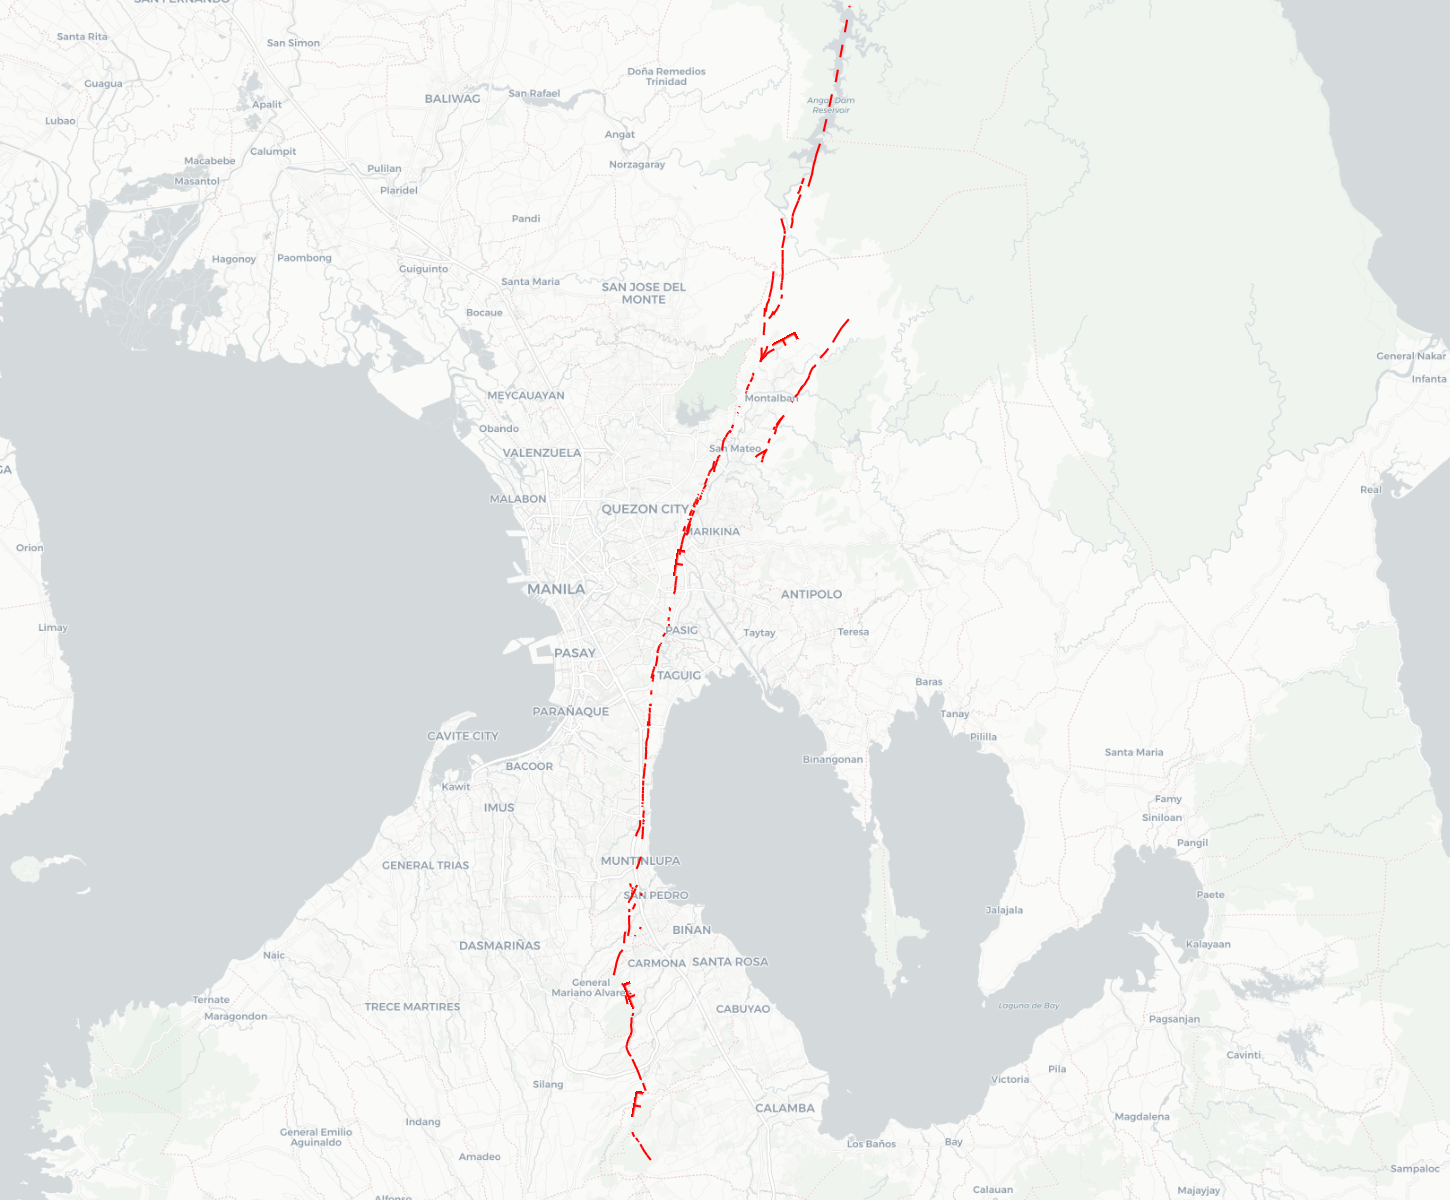
The WVF’s path puts critical infrastructure, densely populated residential areas (like Eastwood City and various subdivisions), business districts, and major landmarks directly within the zone of potential ground rupture or intense shaking, posing a significant threat to life and the economy.
Revisiting the 2013 M7.2 Scenario Study
In 2013, a comprehensive risk analysis study was conducted for Metro Manila, modeling the potential impacts of the Big One triggered by the WVF. This study provides valuable baseline data on projected fatalities and building damage. You can find and download the risk maps here.
Projected Fatalities
The initial casualty map from the study shows high raw numbers in certain areas.

However, raw counts can be misleading as larger administrative areas naturally contain more people. To understand the concentration of risk, we can normalize the data by dividing the projected fatalities by the land area of each administrative boundary (baranggay/city).
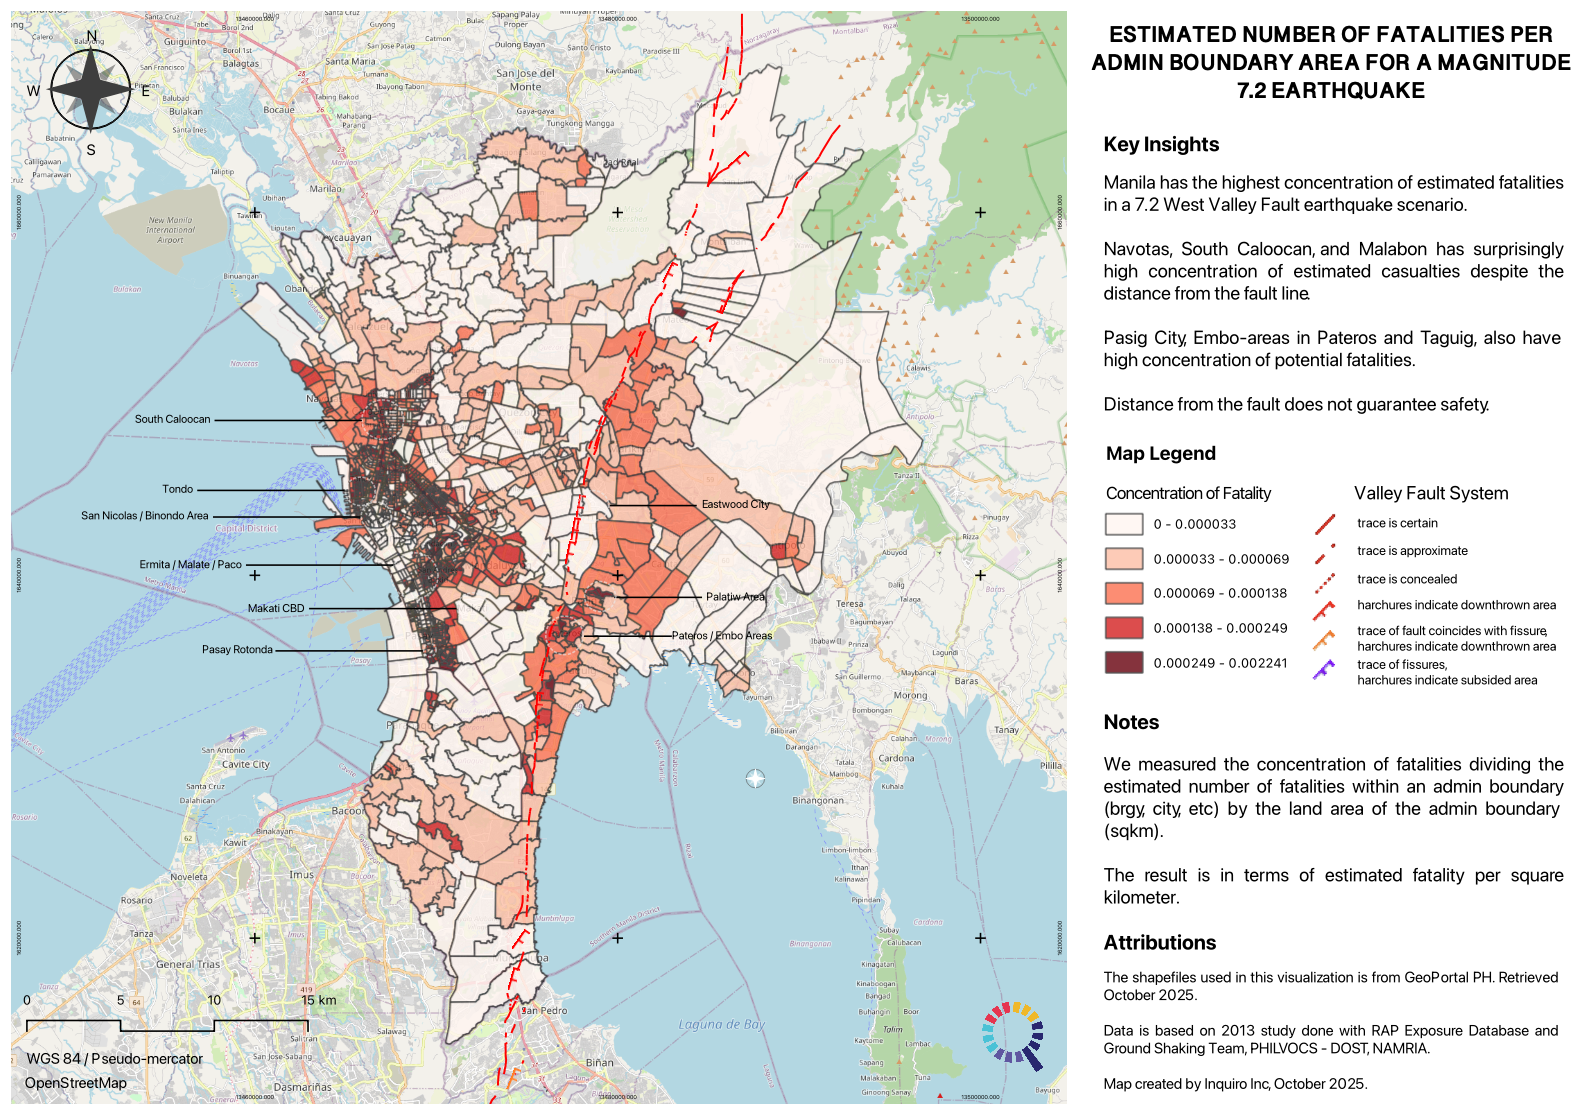
This normalized map reveals areas of high density risk. Notably, many barangays in Manila show high potential fatality concentration despite being further from the fault. Communities in Pateros and Taguig near the fault line also remain areas of significant concern.
Projected Building Collapse
The study also projected the total floor area (sqm) of potentially collapsing buildings within each administrative boundary.

Similar to fatalities, larger areas might show higher total collapse areas simply due to size. Normalizing this data by dividing the total collapsed floor area by the administrative boundary’s land area gives a “Collapsed Floor Area Ratio.”
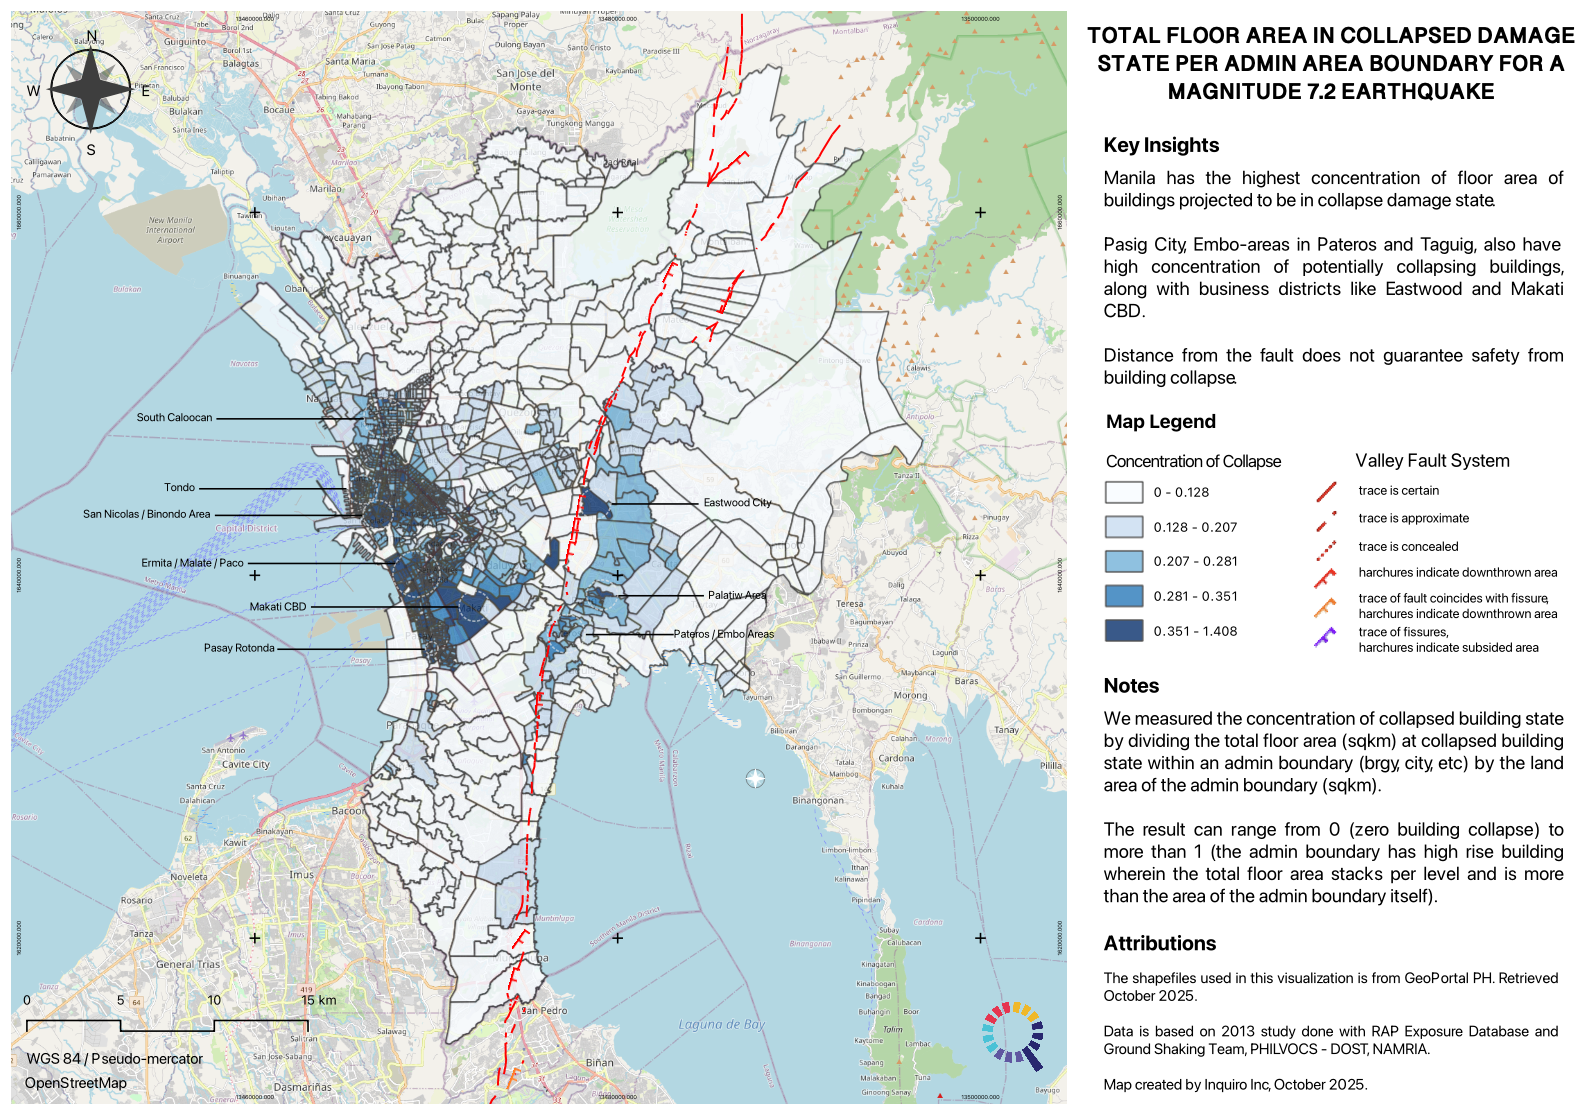
This ratio suggests the concentration of building collapse.
-
Values > 1: Indicate areas where the total floor area of potentially collapsing buildings exceeds the ground area of the boundary itself – typical in districts with many high-rise structures.
-
Lower Values in CBDs?: Interestingly, areas like BGC and the Pasay Bay Area appear to have a lower concentration of collapse potential in this normalized view. This might reflect stricter adherence to building codes in newer developments or differences in building stock assumptions within the 2013 study.
Important Caveat: This analysis is based on 2013 data. Significant changes in infrastructure (new construction, retrofitting, demolition) and building code enforcement have occurred since then, which could alter the current risk profile.
Layering 2025 Resident Data
The most significant limitation of the 2013 study is outdated population distribution. Metro Manila’s demographics have shifted considerably. Using Inquiro’s datalake, we generated an aggregated, anonymized snapshot of resident locations for September 2025, visualized using H3 hexagons (Uber’s hexagonal grid system) for consistent spatial analysis. We layered this with the normalized collapse building area map to highlight areas of concern and to improve data privacy of the residents.
By overlaying the 2025 resident density map (using transparency or blend modes) onto the normalized collapsed building area map (from the 2013 study), we get a more current perspective on potential population exposure.
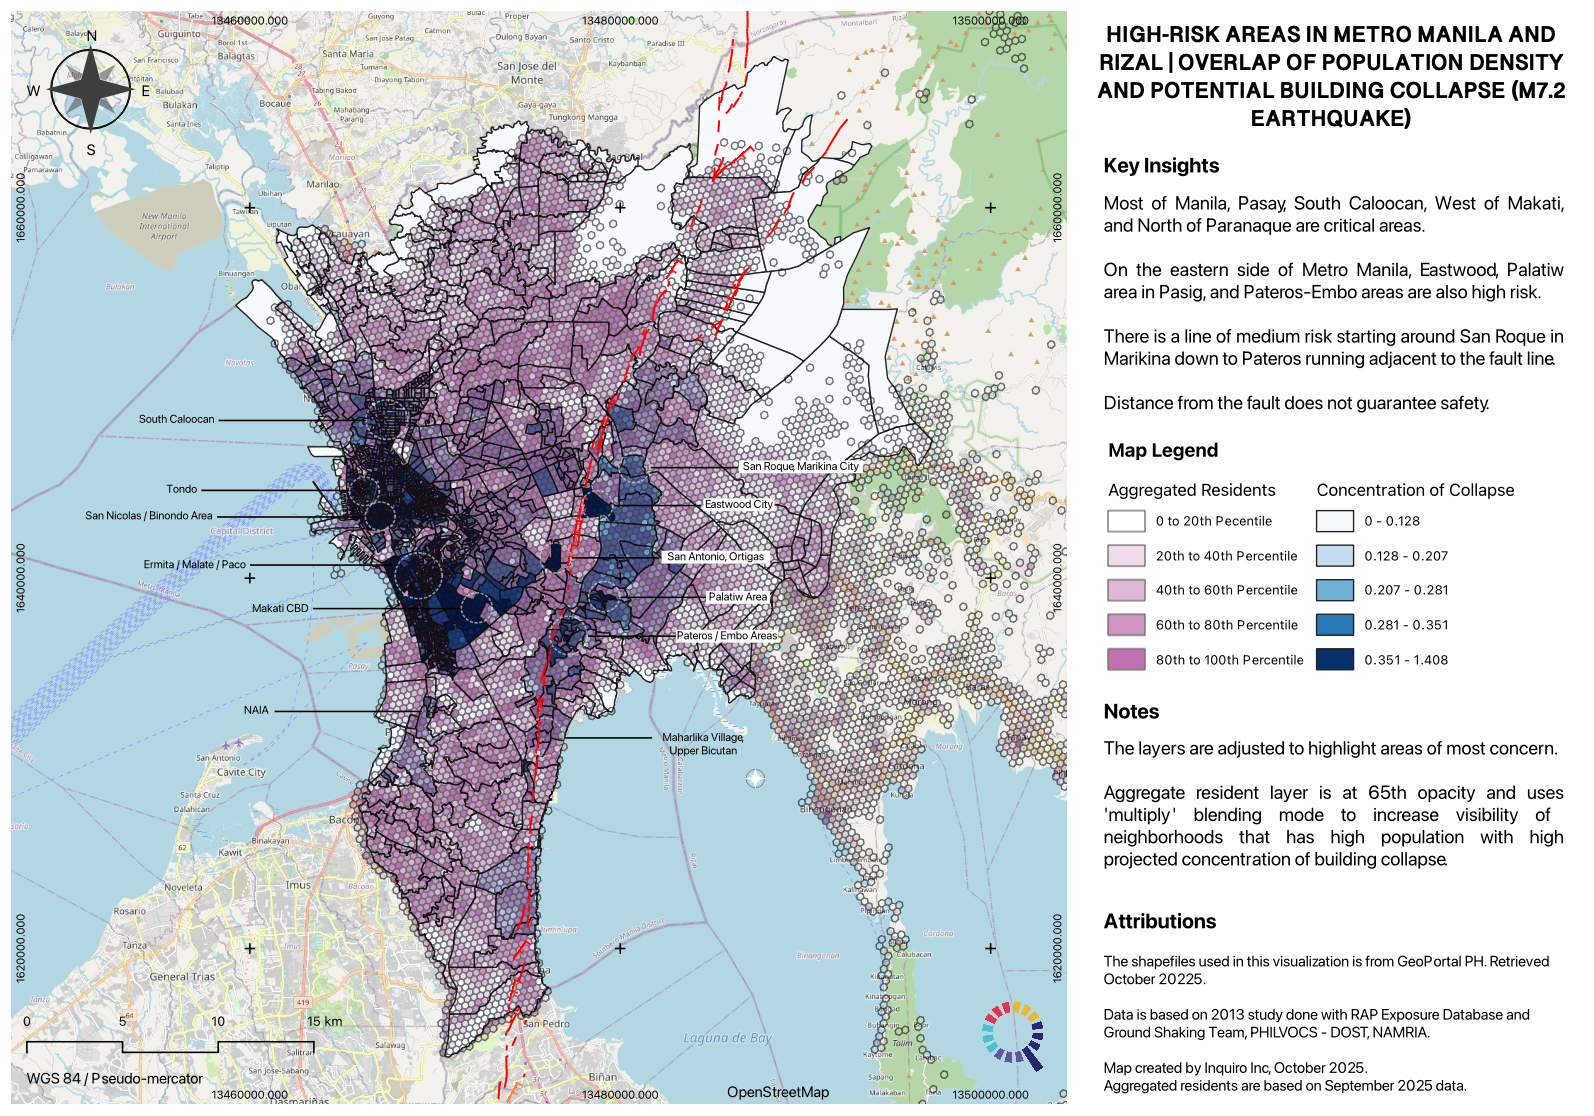
Key Insight: This combined view starkly illustrates that distance from the fault line does not equate to safety. The entire western portion of Metro Manila – including South Caloocan, Manila, western Makati, Pasay, and northern Parañaque – emerges as an area of major concern due to the combination of high population density and significant projected building collapse concentration, despite its distance from the WVF compared to areas like Quezon City. Public awareness and mitigation efforts may need to focus more intensely on these western zones.
Mitigation Efforts Underway
Recognizing the risks, government agencies and international bodies are taking action. The DPWH has assessed numerous public buildings, recommending many for structural retrofitting. In 2021, the World Bank approved substantial funding to improve the resilience of hundreds of schools and health facilities in Metro Manila, critical infrastructure during and after a disaster.
Conclusion: Data is Key to Resilience
This analysis, combining the foundational 2013 M7.2 scenario study with up-to-date 2025 population data, underscores the complex nature of the Big One risk in Metro Manila. Normalizing risk factors by area provides crucial insights into concentration, while current population data highlights where people are most exposed today. The clear takeaway is that vulnerability extends far beyond the immediate vicinity of the West Valley Fault, particularly impacting densely populated areas in the western part of the metropolis.
Effective disaster risk assessment and mitigation rely on accurate, timely, and dynamic data. Geospatial technologies (GIS), combined with resources like Inquiro Inc.’s aggregated resident data, are essential tools to bridge knowledge gaps, generate meaningful insights, and ultimately build a more resilient region.
If you’re interested in leveraging data for risk assessment or understanding population dynamics, contact us for a demo.