How Flooding Paralyzes Travel in Metro Manila
Flooding is the number one issue in the Philippines at the moment. Flooding has been a major issue in the Philippines for a very long time. There are notes from Rizal himself on how he would fix the flooding in the growing metro back then. Several plans and attempts have been made during the American occupation, and Marcos years and so on. Those plans never materialized and the ones that were built were insufficient to the growing population of Metro Manila.
In this article, we will look at the effect of torrential rain, and flooding to the everyday travel in Manila.
We studied the effect of flooding on people movement, using our footfall data. 10 bridges were analyzed along Pasig River, off of which we will present 3. The day, July 22 2025 Tuesday.
Typhoon Crising, combined with southwest monsoon is ravaging Metro Manila. Classes and government work were suspended, night of July 21st. Several roads were already not passable.
The Metropolitan Manila Development Authority at 6:11 p.m. listed the following flooded roads.
-
España Lacson WB: Knee deep. Not Passable to light vehicles (NPLV)
-
España Blvd cor Antipolo St, Knee deep. Not passable to light vehicles (NPLV)
-
Taft Avenue cor. UN Ave. (13 inches) Half tire deep. Not passable to light vehicles (NPLV)
As of 6:40 a.m. July 22 2025, here are the flood conditions on several main roads in Metro Manila, according to the MMDA:
-
Espana Dela Fuente: Tire Deep. Not passable to all types of vehicles
-
Espana Blvd Antipolo: knee deep. Not passable to light vehicles
-
España Lacson westbound: Knee-deep. Not passable to light vehicles
-
España Blvd corner Antipolo St.: Knee-deep. Not passable to light vehicles
For better context here is a flood and landslide risk map from MGB:
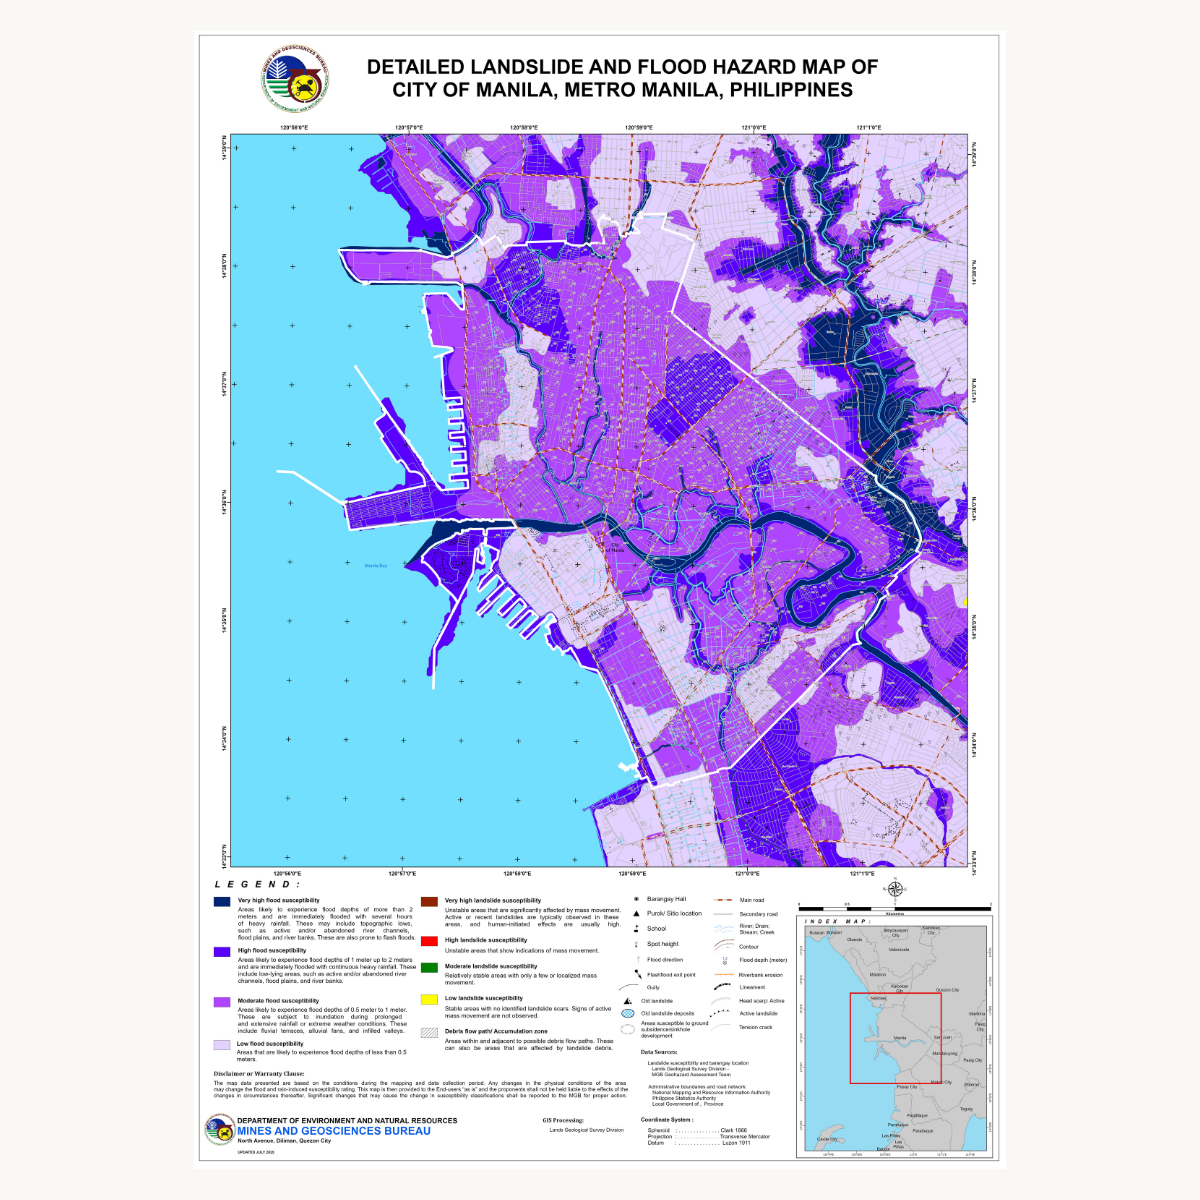
Delpan bridge is a 4 lane commuter bridge, with few to no PUVs passing through. It’s the last bridge downstream of Pasig River. Roads to and from Delpan bridge are not included in the MMDA list of un-passable roads. The flood and landslide risk map has Delpan bridge and surrounding areas as low flood susceptibility.
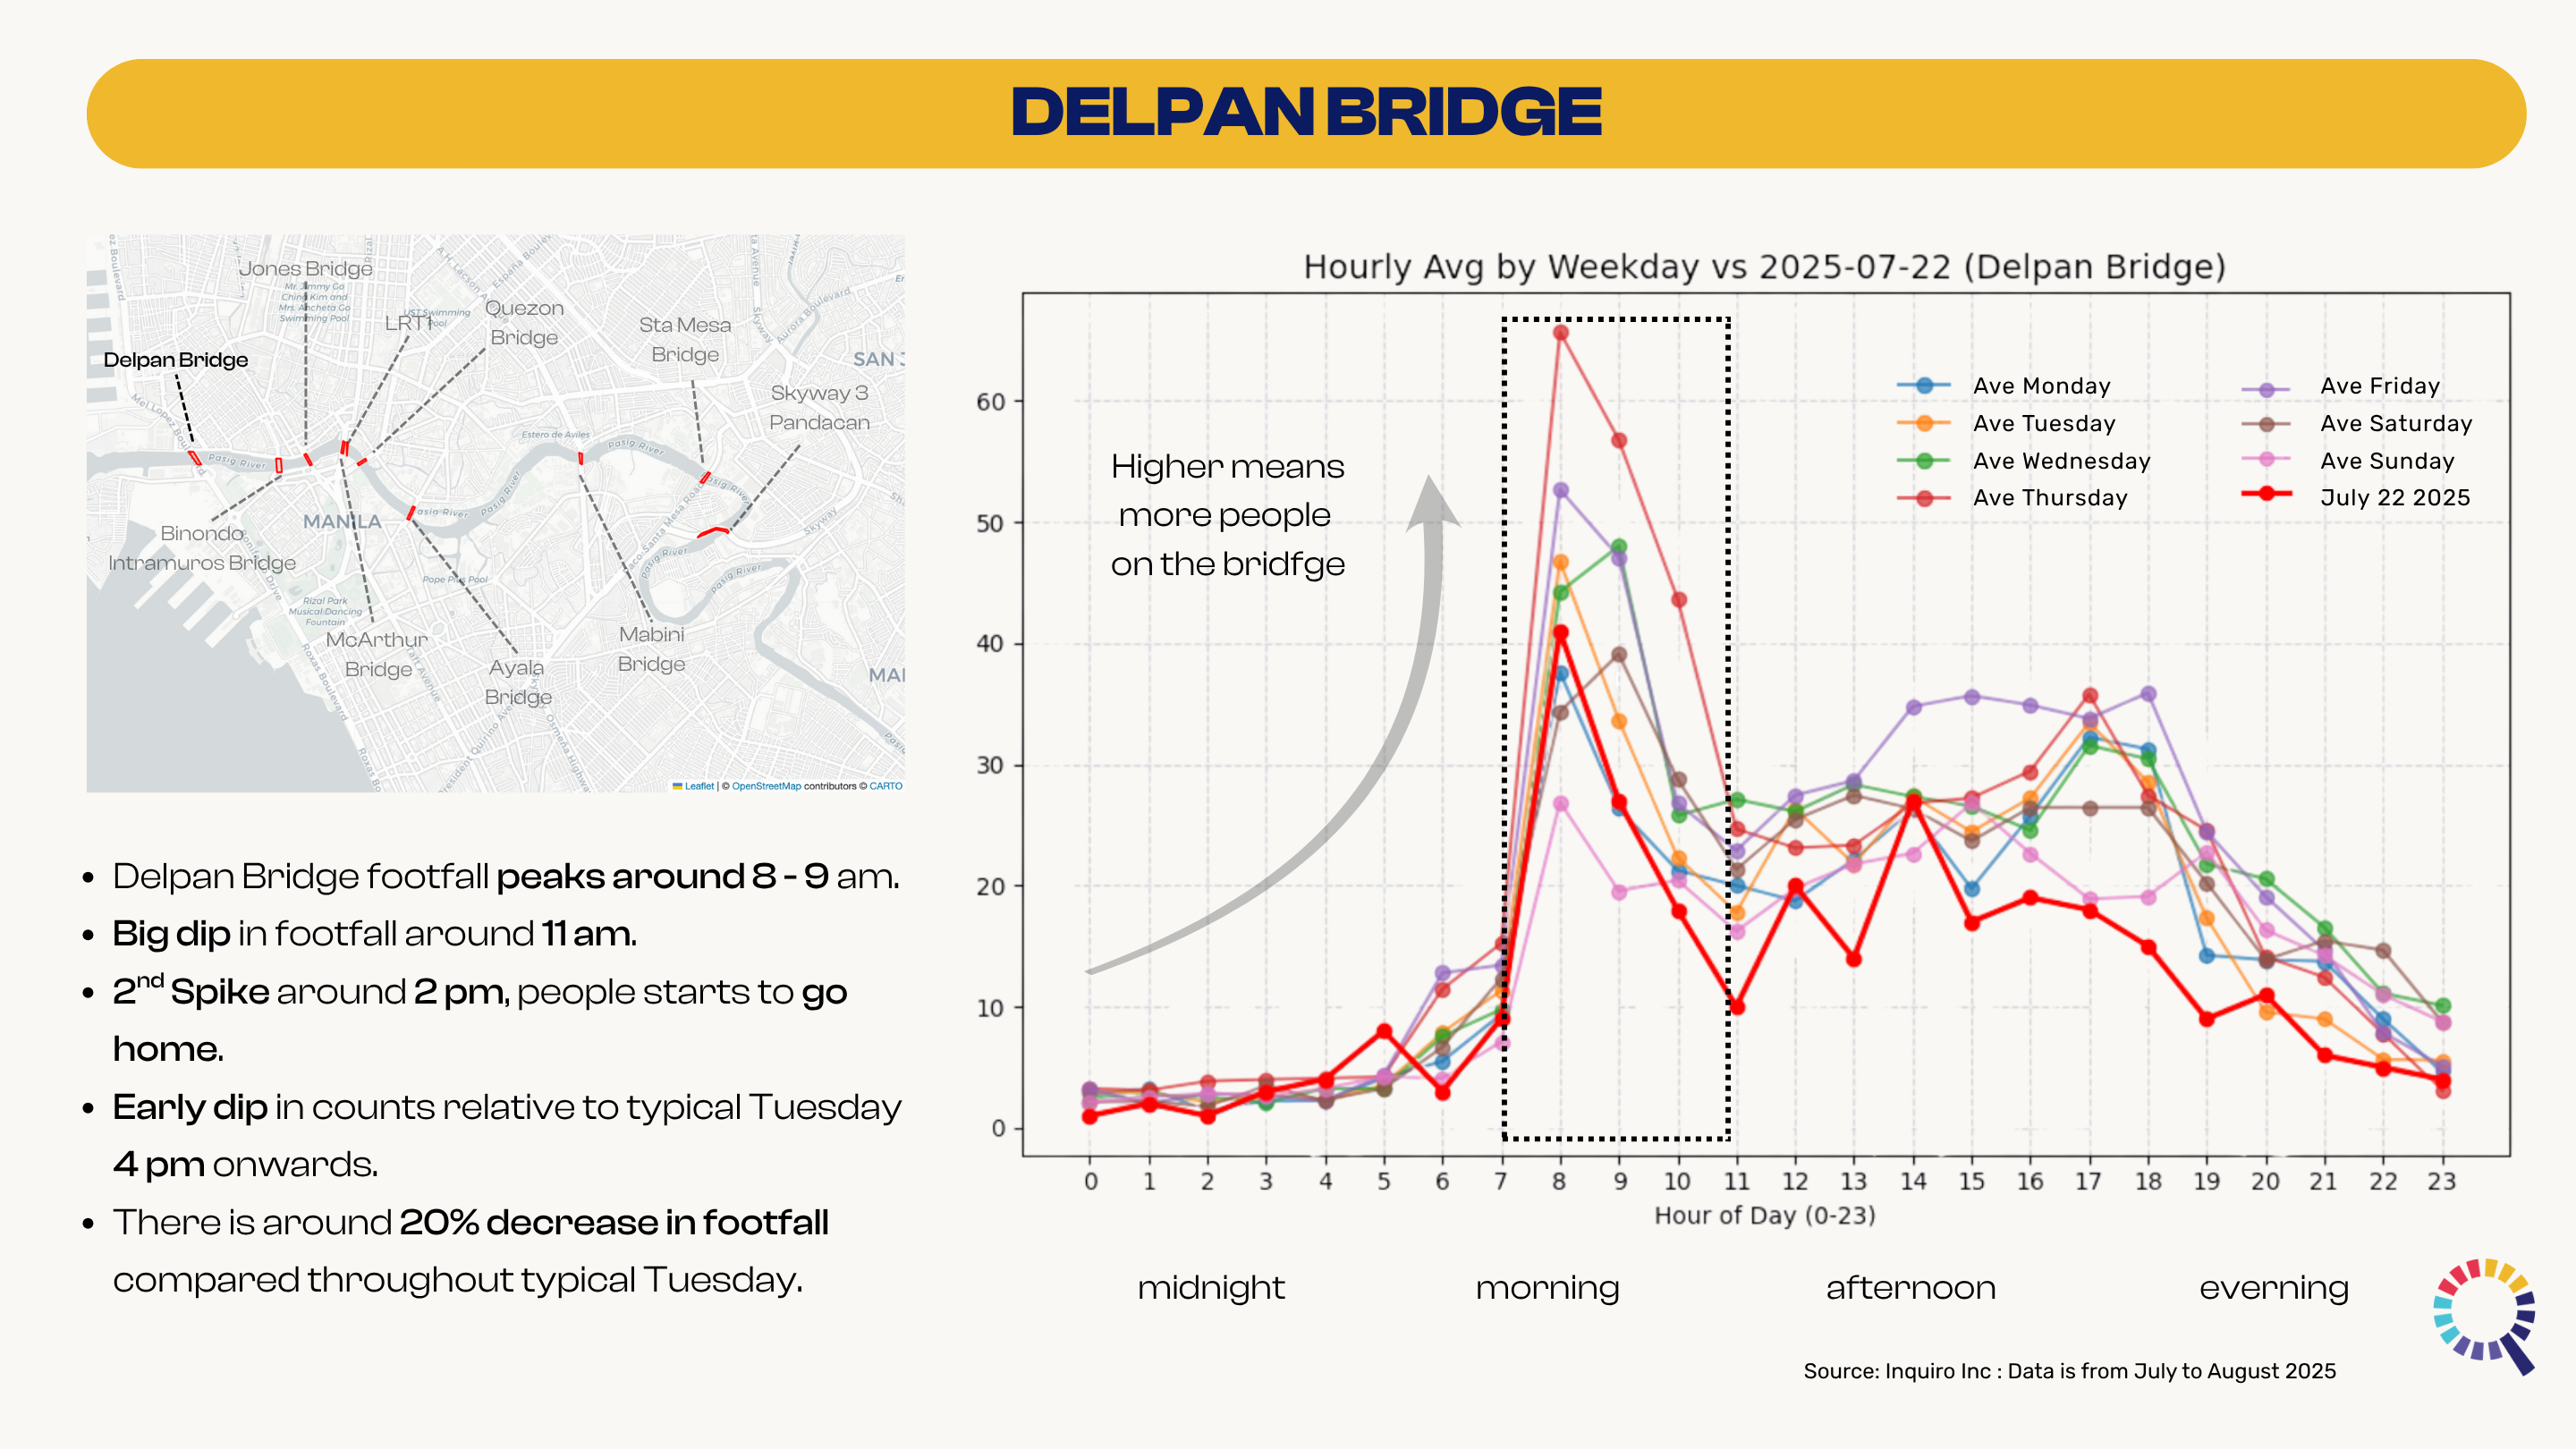
The figure above is a sample list of people on the Delpan bridge, average per day. The red line is the day of interest – July 22.
As expected no one is detected around 12 am to 4, then 5 am it started to increase. Highest count is seen around 8 to 9 am. From then, the count dips quickly dropping the most around 11 pm. Slight uptick around 1 pm to 2pm then big dip at 4 pm onwards – a big discrepancy from typical Tuesday count in the afternoon.
Delpan bridge is not a commuter bridge, it has the highest utility drivers (trucks, vans, etc) among all the bridges in our list. We can still see a noticeable dip in counts during the flooding as compared to the average Tuesday.
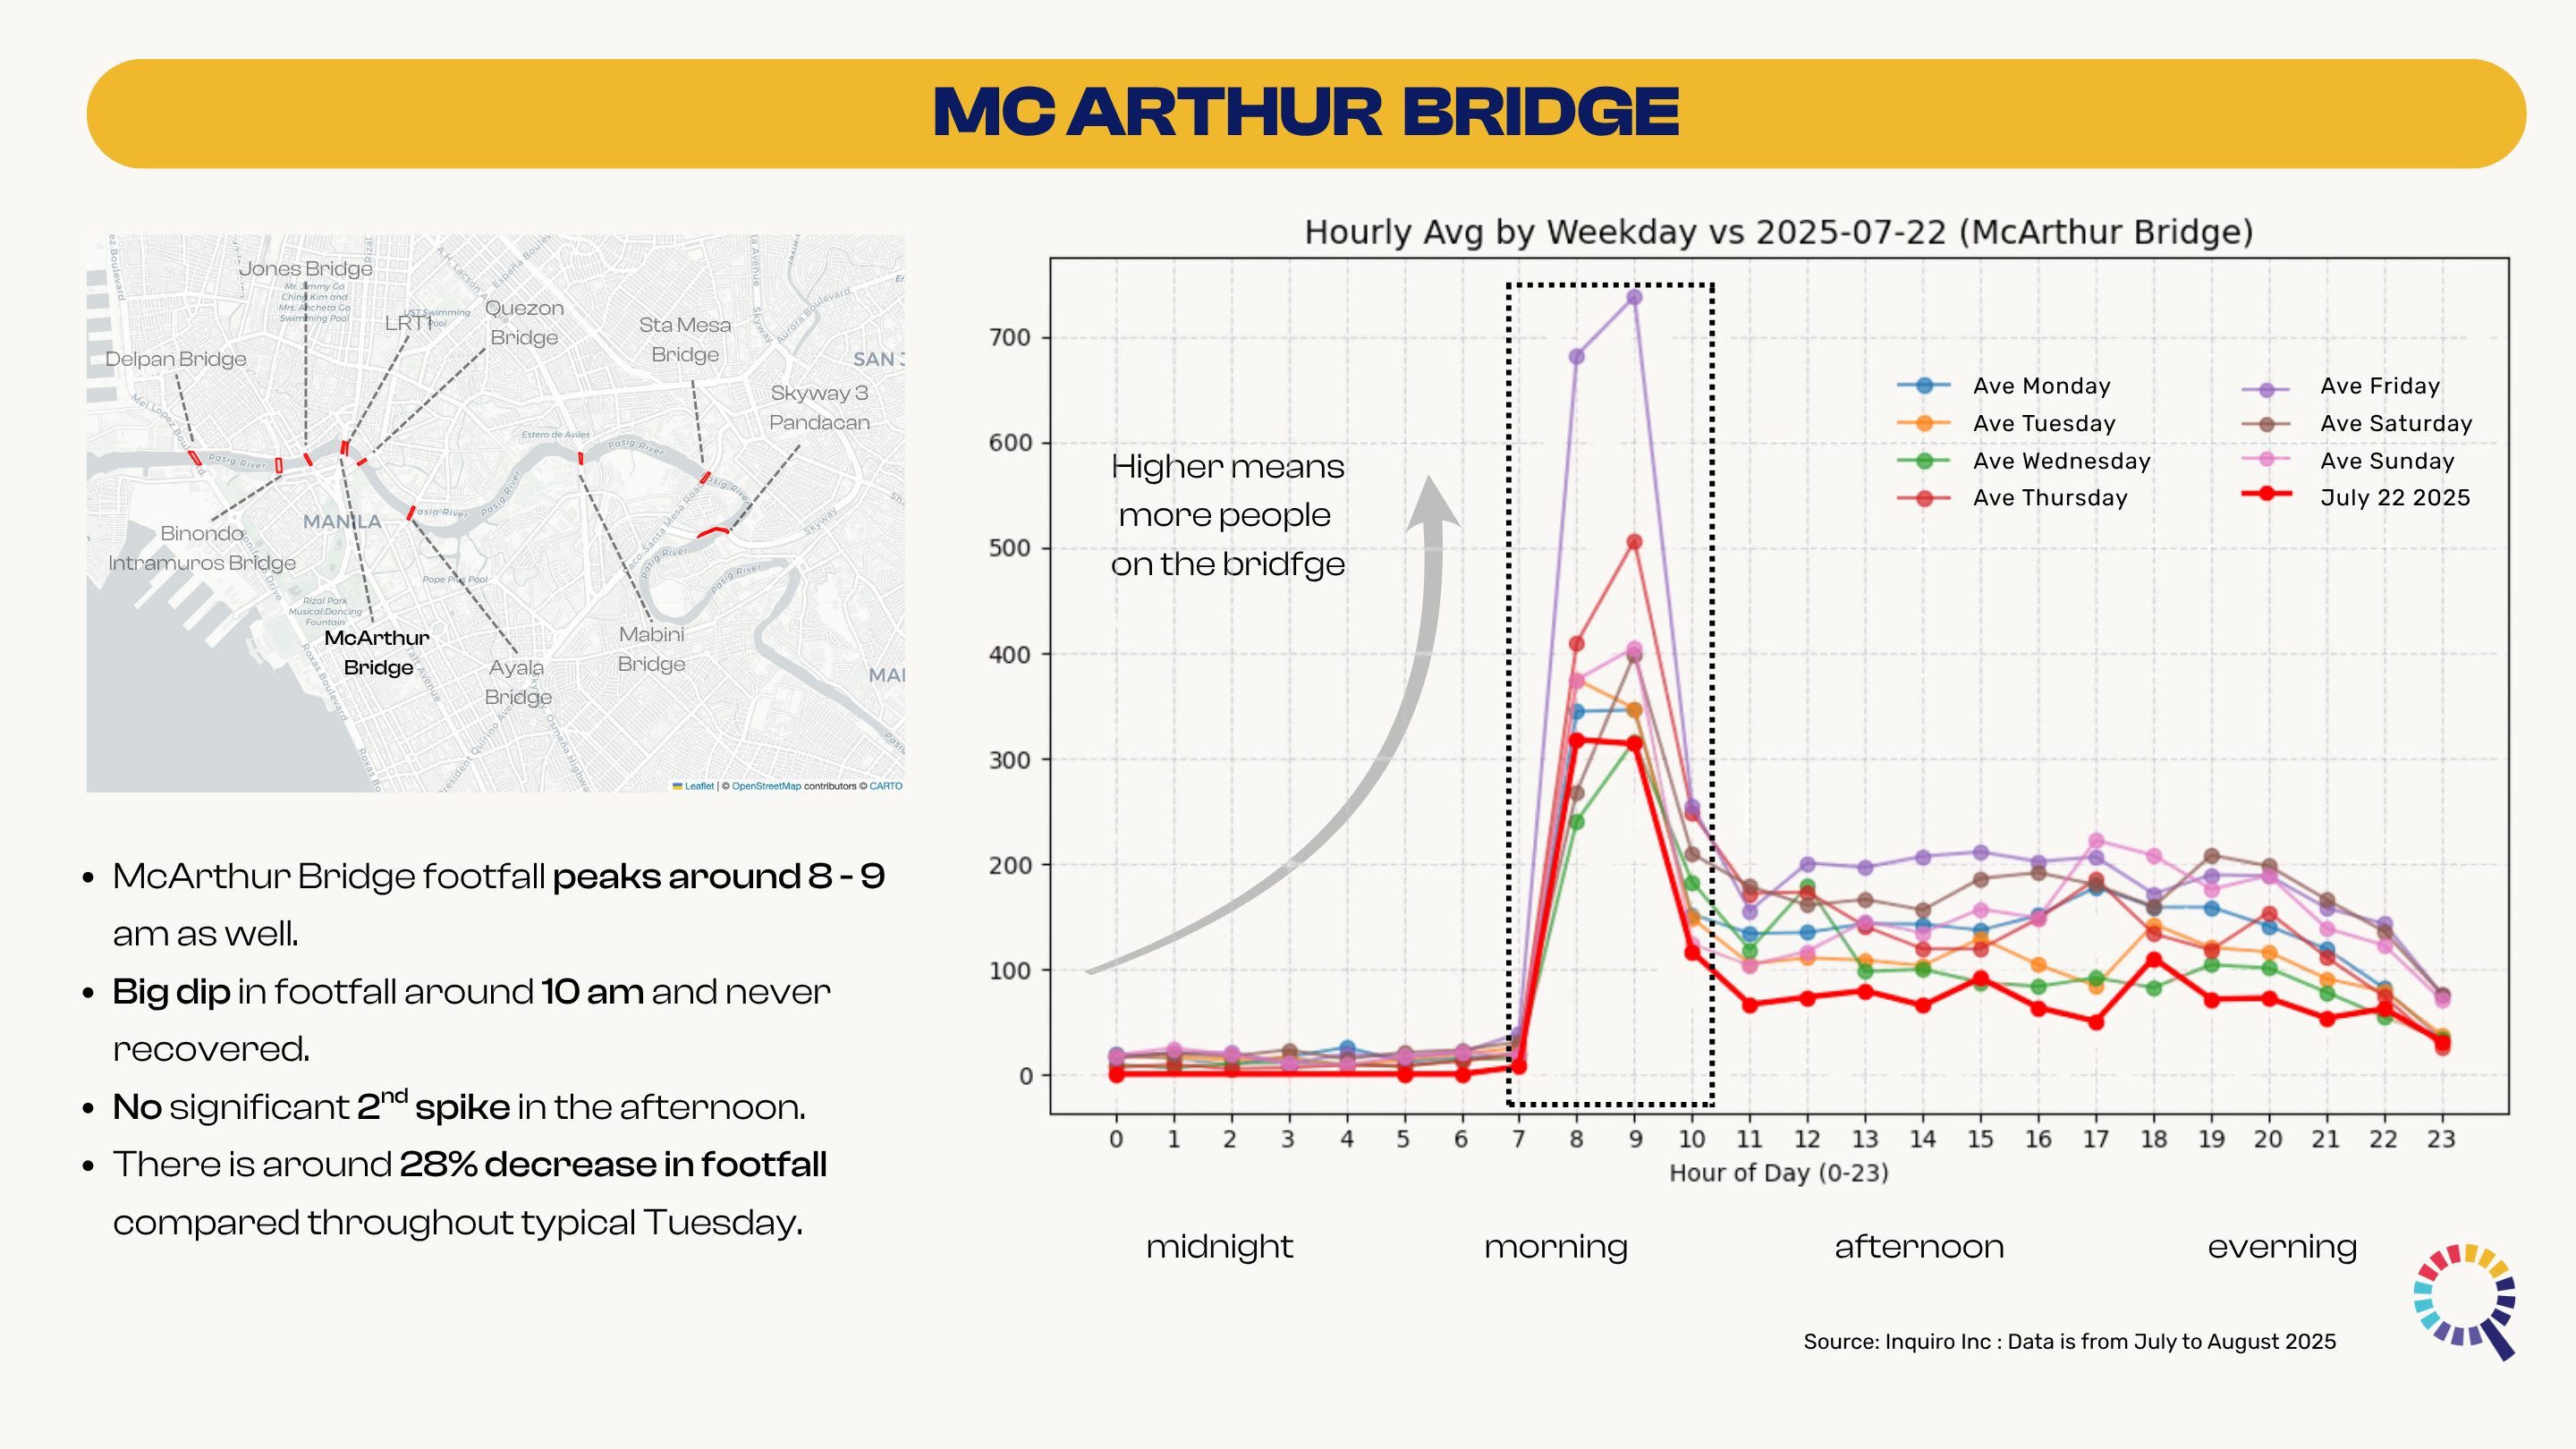
Further upstream, McArthur Bridge is a commuter bridge. It currently caters Jeepneys, mini buses, and buses going from and to Rizal Avenue / Taft Avenue. We can definitely see that from the chart. The flood risk map has tagged McArthur bridge and it’s surrounding roads as moderate susceptibility.
The highest peak is around 9 am to 10 at around 700 sample, on a Friday. July 22 as expected, lower counts than typical Tuesday on the bridge. What is interesting is the seemingly flat curve on the afternoon.
Typically, on a trip, commuters collectively go out at the same time (9 am to 10 am peak) and returns home at around the same time (4 pm to 7pm). This effect is stronger for places around school or office buildings. In this case, we dont see that. We see a flat curve.
This suggests that commuters traveling across have diverse destinations and motivations. They could be visiting a museum for a short while, commuting for their groceries, eating out, etc. These are activities that doesnt have a fixed dwell time, that you all go home at the same time.
Another explanation could be that commuters, drivers especially choose another bridge in the afternoon. But it’s not because of the flood, it happens all the time – at least for July to August.
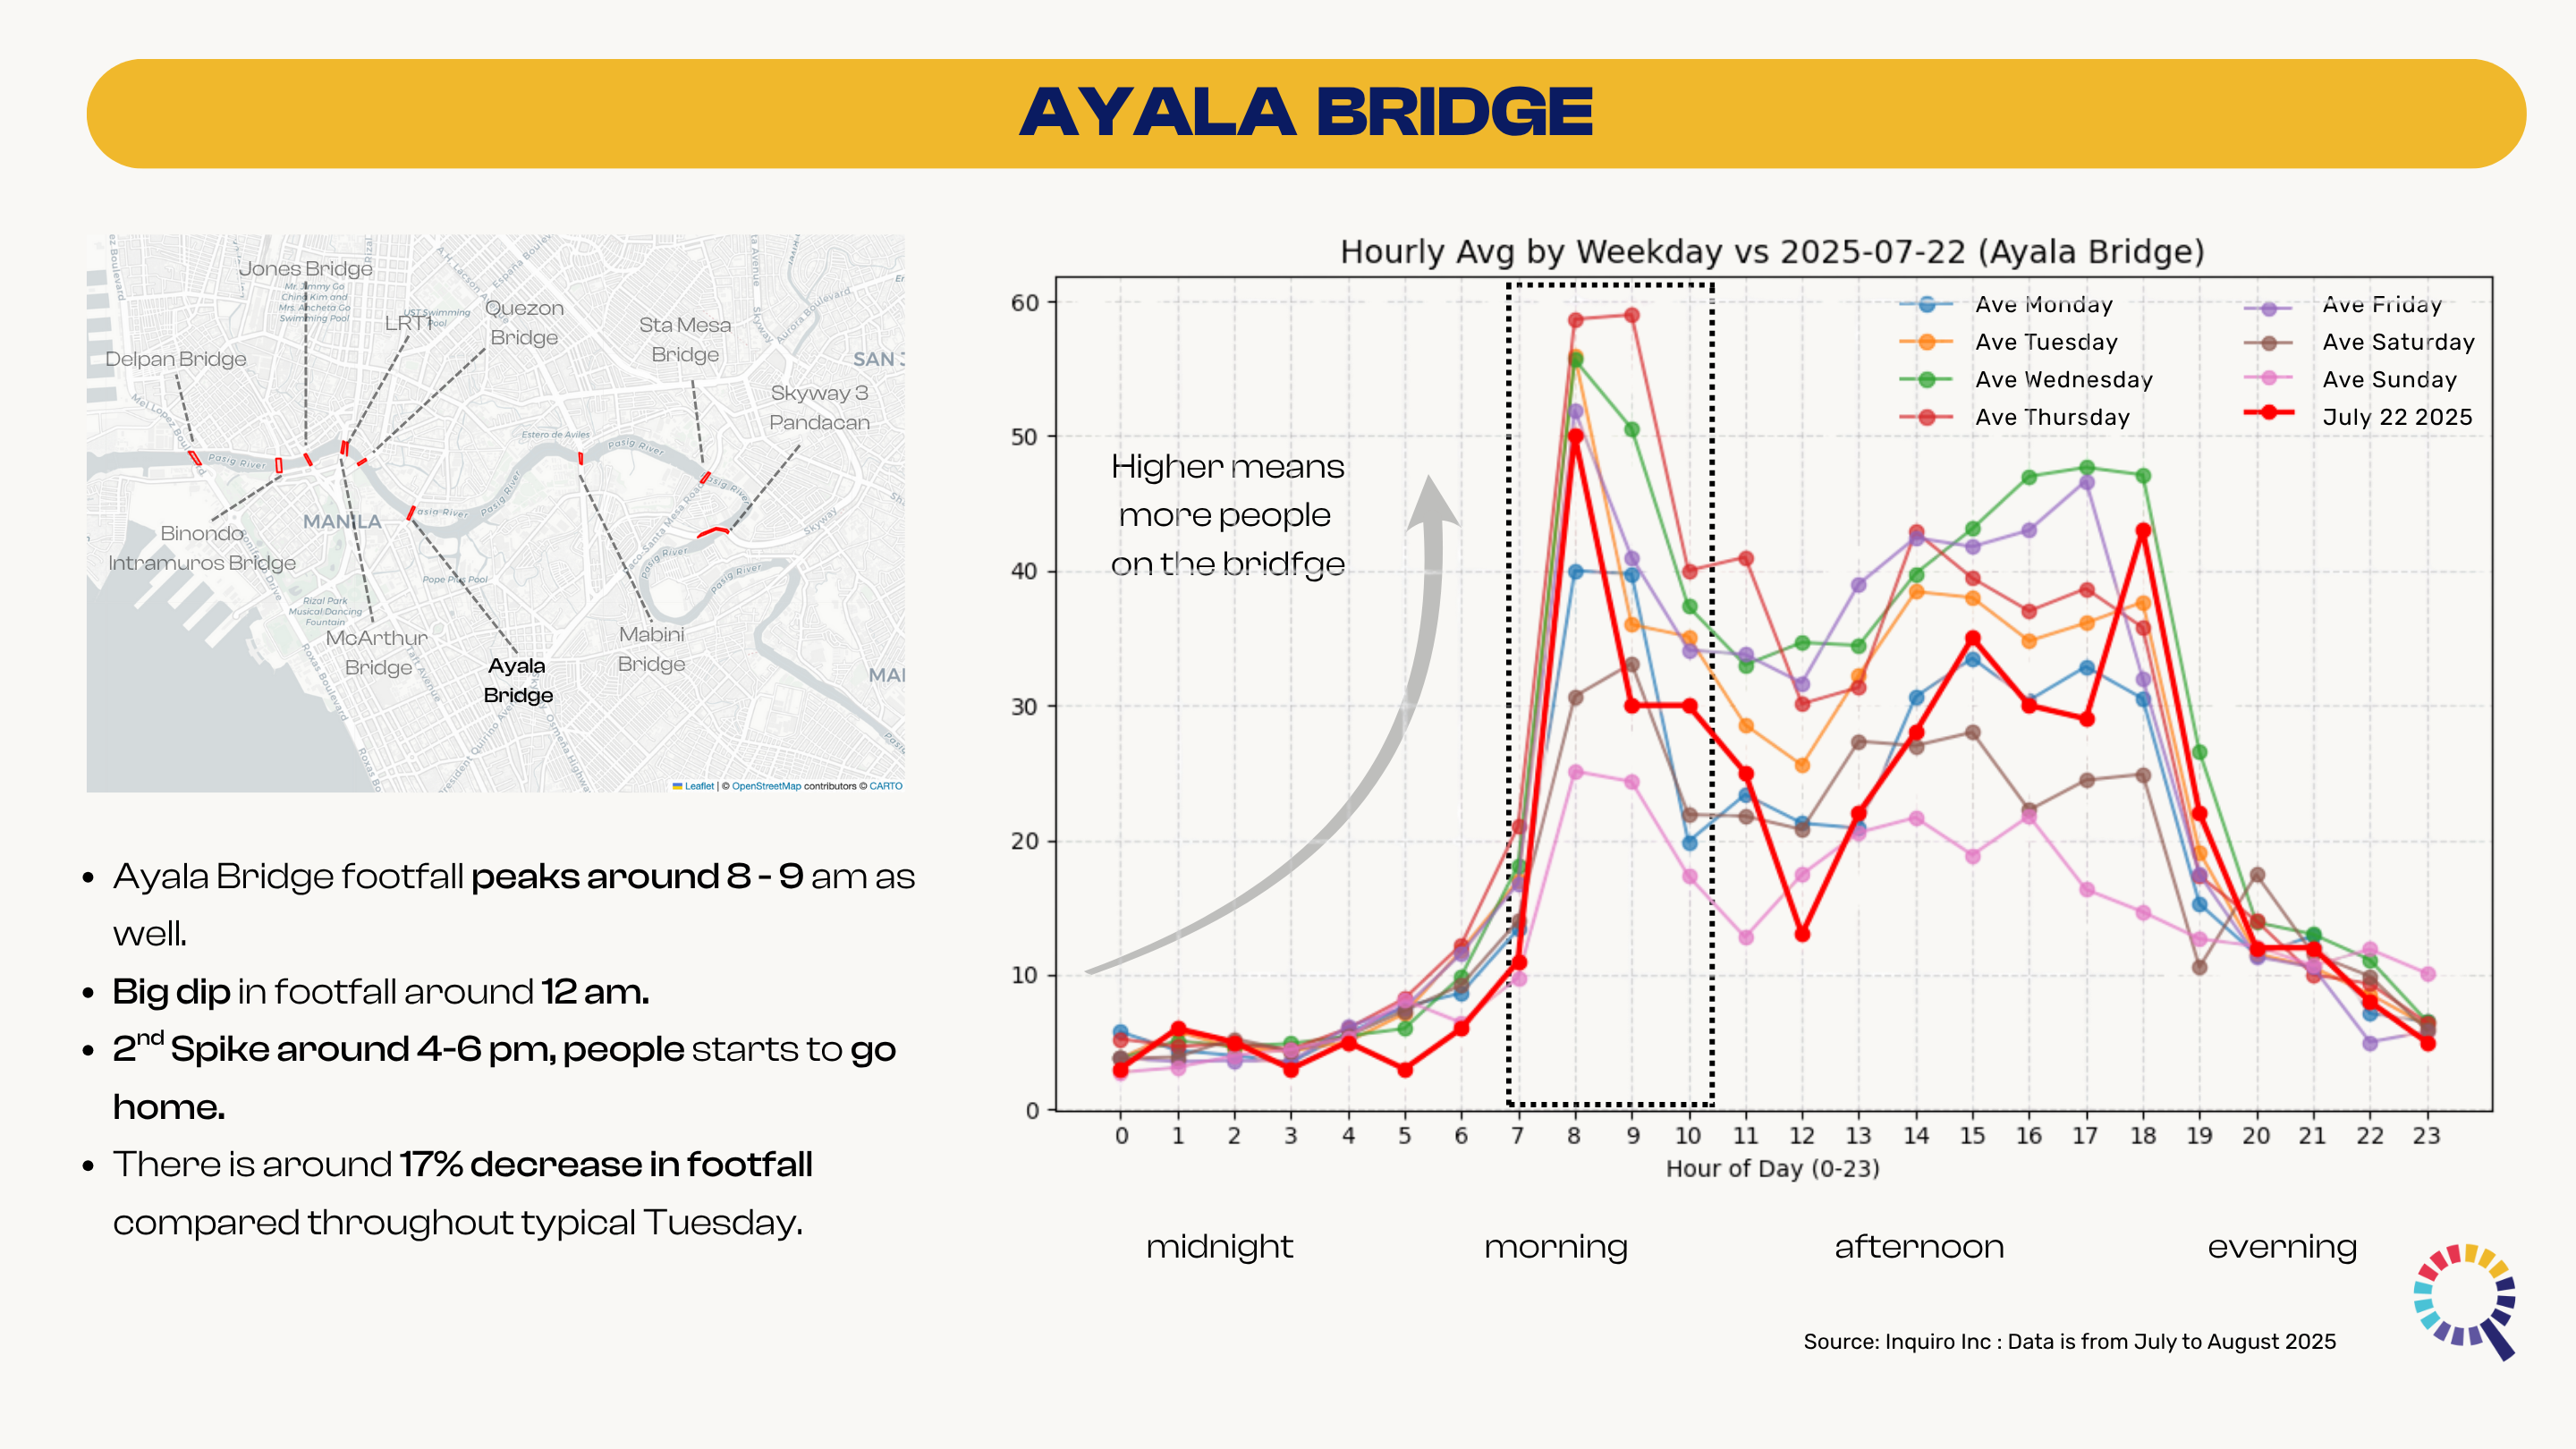
Quick look at the chart, it’s hard to avoid seeing the spike in the afternoon. As discussed this is the expected graph of roads near schools, office spaces. People going to school, work in the morning, then leaving in the afternoon. The flood risk map has tagged Ayala Bridge and its surrounding roads around moderate susceptibility.
What’s interesting with Ayala bridge is it’s not a commuter bridge, it has a high private car count. In the morning, it has a slightly delayed ramp up between 5-7. The count spike around 8 am to 9, almost matching the typical Tuesday, then drop on midday. The count chart followed the typical Tuesday, slightly lower, except on 6pm. At 6 pm, July 22, it actually surpasses the typical Tuesday line.
Another observation is the afternoon spike in Ayala Bridge is much much bigger than the morning spike, in volume. The afternoon commute volume is more spread out but they sum to bigger than the morning. This could be due to the usual cars crossing Ayala Bridge – private cars that has a choice. This is supported by the unusual spike at 6 pm. Drivers, that has the option to opt to another bridge, choose Ayala Bridge going home.
This article is raising a lot more questions that answers. We need more datasets to study them further. The take away here is flooding leads to less people traveling. On the macro level, less people traveling means low economic stimulus, loss of classroom time for students, etc. Now, despite the suspension of classes and government work, people still go out in the morning. Movement friction is more apparent in the afternoon. Filipinos are resilient, but we need more proactive actions to mitigate the effects of flooding in the country – especially capital Manila.
This article focuses on movement data during flooding. In the future, we can look into vulnerable population (using demographic data) due to flood inundations, fault lines, volcano hazard zones etc.
Want to learn more about our products? Contact us at info@inquiro.ph